
Offensive Drives
updated January 28, 2024
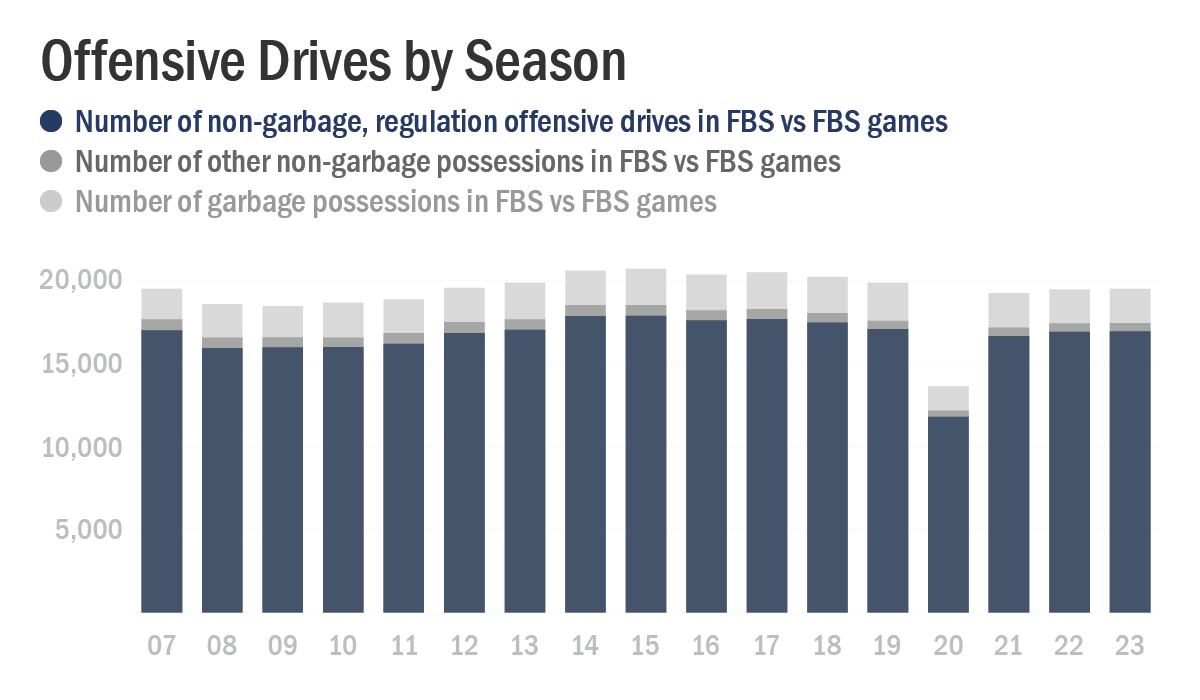
The majority of game possessions are categorized as offensive drives, defined as possessions that consist of at least one scrimmage play run by an offense against the opposing team defense. From 2007 to 2023, there were a total of 282,819 non-garbage, regulation offensive drives in FBS vs FBS games, an average of 22.6 drives per game (11.3 per team). Unless otherwise noted, all ratings and analysis of offenses and defenses on this site are produced from this set of drives.
The primary objective of the offense on a drive is to produce points by advancing the ball into field goal range or into the end zone for a touchdown, and the primary objective of the defense is to prevent the offense from doing so. From 2007 to 2023, offenses scored an average of 2.15 points per drive, calculated as follows:
- Safeties: recorded as a drive result of negative two points scored.
- Touchdowns followed by an extra point or two-point conversion attempt that was returned for a defensive score: recorded as a drive result of four points scored.
- Total points scored including field goals, touchdowns, extra points, and two-point conversions at the conclusion of all other drives: recorded as scored (3, 6, 7, or 8 points).
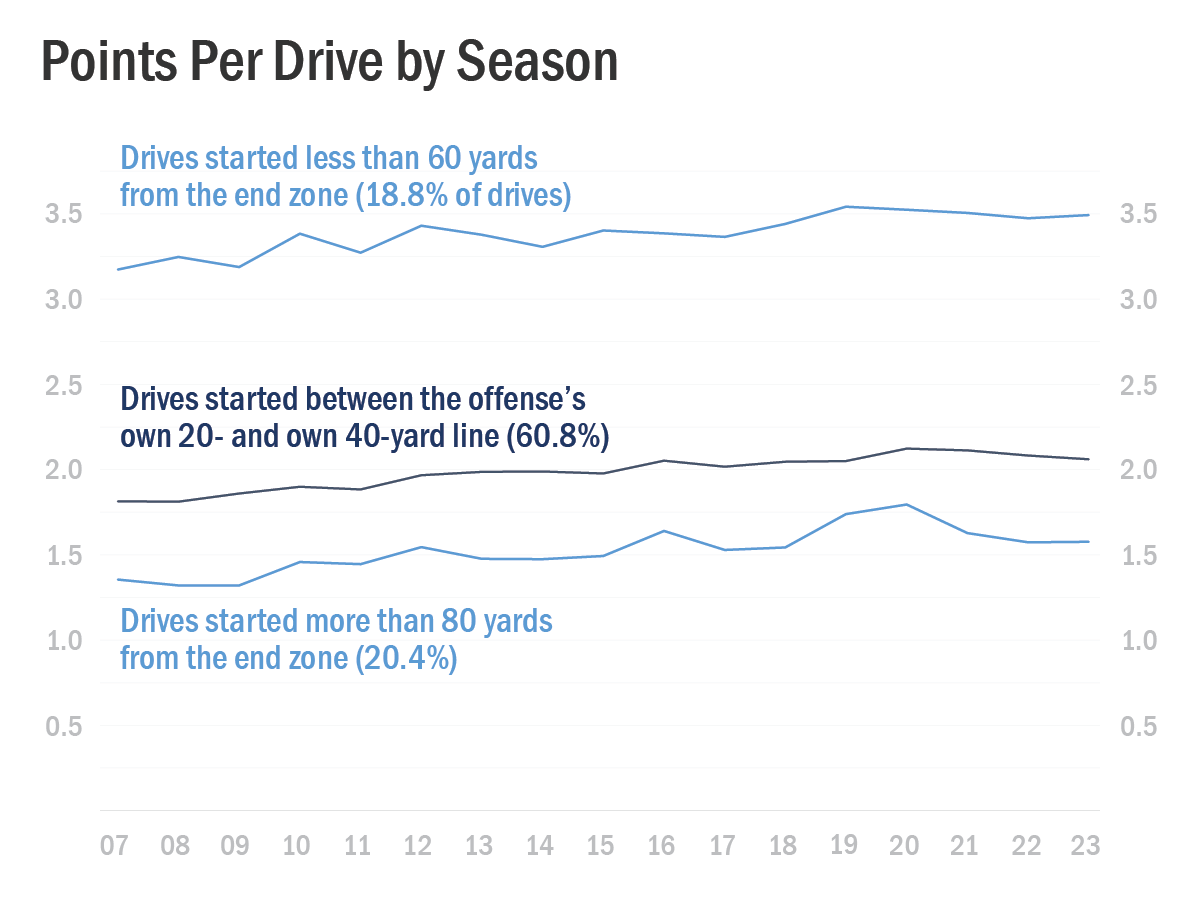
Offensive scoring rates vary by drive depending on how close the drive starts to the end zone.
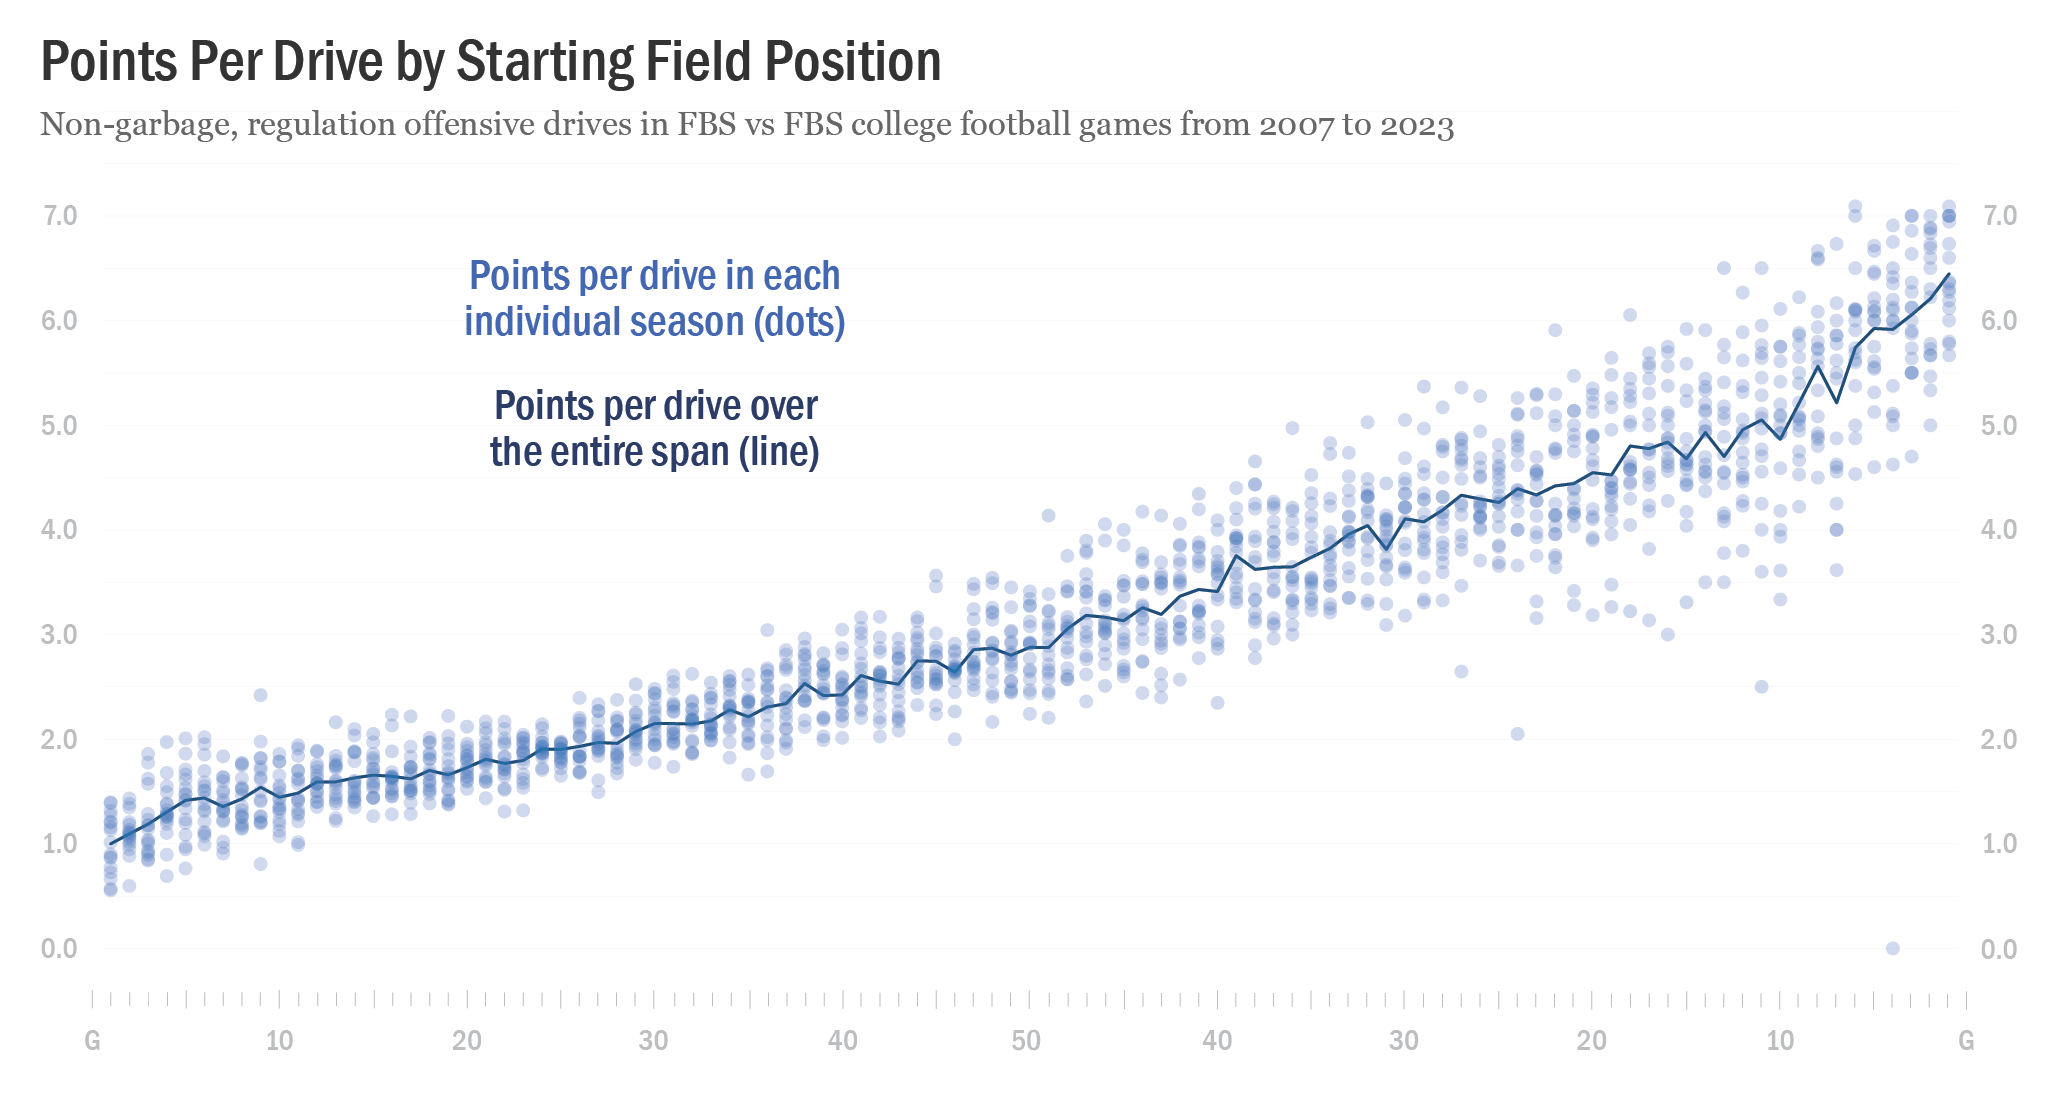
The relationship between starting field position and points scored per drive is one of the primary factors used in offensive and defensive efficiency calculations on this site. Though the chart illustrates this relationship, it also obscures other factors like variations in points per drive rates by season and the frequency of drives by starting field position.
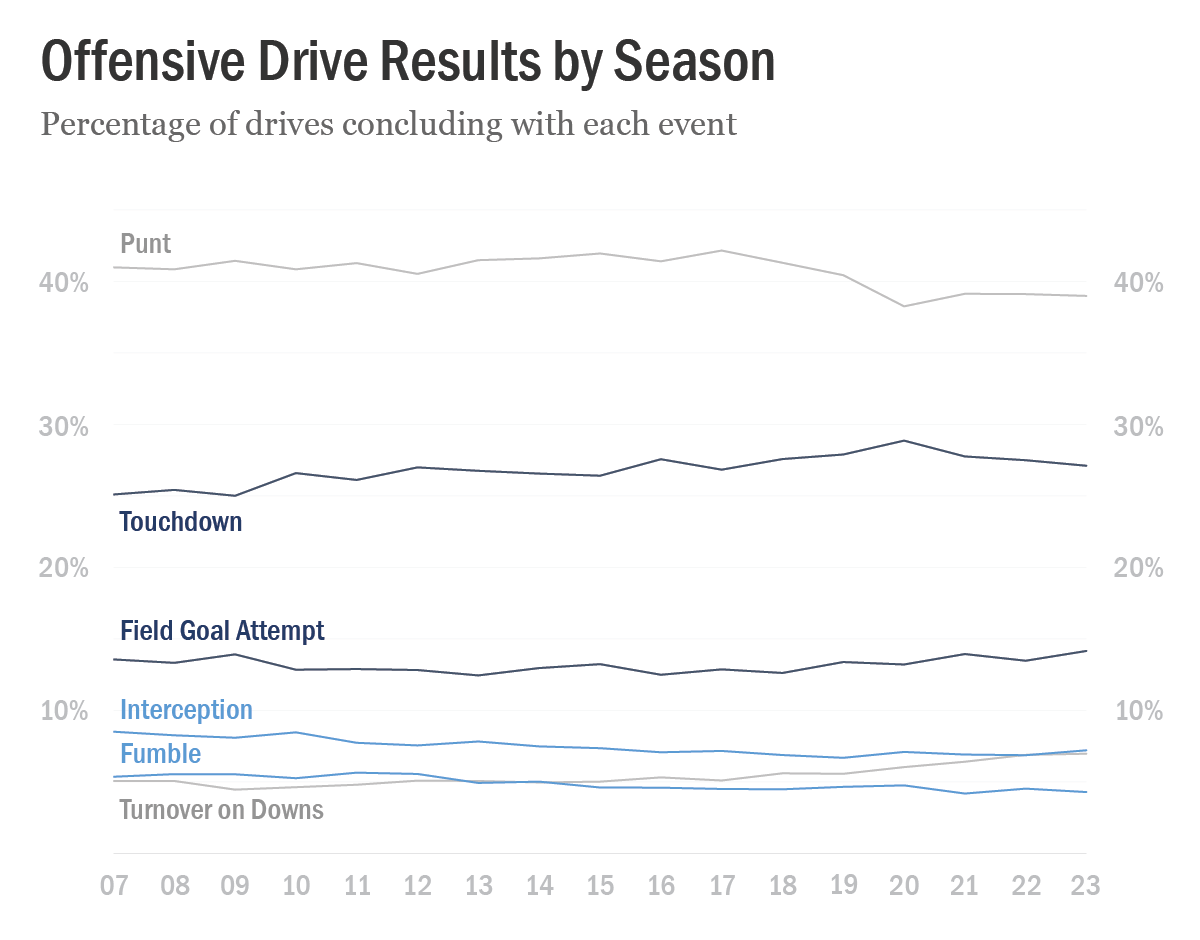
There are six ways in which an offensive drive can start: kickoff, punt, fumble, interception, turnover on downs, and failed field goal. There are eight ways in which an offensive drive can conclude: touchdown, field goal attempt, punt, turnover on downs, fumble, interception, safety, or time expiring at the end of the half. The frequency of drive outcomes also varies by season.
Detailed data including results by starting field position for each individual season from 2007 to 2023 are linked from the table below.
Drive Start Events |
Drive End Events |
|||||||||||||||||
| Span | Drives | PPD | KO | Punt | Fum | Int | Down | FFG | TD | FGA | Punt | Down | Fum | Int | Saf | Half | ||
| 2007-23 | 282,819 | 2.15 | .433 | .384 | .053 | .058 | .043 | .029 | .268 | .132 | .407 | .054 | .049 | .075 | .002 | .012 | ||
| Season | Drives | PPD | KO | Punt | Fum | Int | Down | FFG | TD | FGA | Punt | Down | Fum | Int | Saf | Half | ||
| 2007 | 17,005 | 2.04 | .414 | .388 | .059 | .067 | .040 | .032 | .251 | .136 | .410 | .051 | .054 | .085 | .003 | .011 | ||
| 2008 | 15,930 | 2.04 | .421 | .383 | .061 | .062 | .039 | .033 | .254 | .133 | .408 | .051 | .055 | .083 | .003 | .012 | ||
| 2009 | 15,980 | 2.04 | .422 | .389 | .061 | .062 | .034 | .031 | .250 | .139 | .414 | .045 | .055 | .081 | .003 | .013 | ||
| 2010 | 15,985 | 2.13 | .428 | .383 | .059 | .065 | .036 | .029 | .266 | .128 | .409 | .046 | .053 | .085 | .002 | .011 | ||
| 2011 | 16,183 | 2.08 | .420 | .389 | .062 | .060 | .037 | .031 | .261 | .129 | .413 | .048 | .057 | .077 | .003 | .013 | ||
| 2012 | 16,840 | 2.15 | .428 | .382 | .059 | .060 | .041 | .030 | .270 | .128 | .405 | .051 | .056 | .076 | .002 | .013 | ||
| 2013 | 17,033 | 2.13 | .429 | .389 | .053 | .062 | .041 | .027 | .268 | .124 | .415 | .051 | .049 | .078 | .003 | .012 | ||
| 2014 | 17,866 | 2.12 | .425 | .392 | .054 | .058 | .040 | .030 | .266 | .130 | .416 | .050 | .050 | .075 | .002 | .012 | ||
| 2015 | 17,880 | 2.13 | .429 | .396 | .050 | .056 | .040 | .029 | .264 | .132 | .419 | .050 | .046 | .074 | .003 | .011 | ||
| 2016 | 17,603 | 2.20 | .437 | .391 | .050 | .054 | .043 | .025 | .276 | .125 | .414 | .053 | .046 | .071 | .003 | .013 | ||
| 2017 | 17,682 | 2.15 | .433 | .397 | .048 | .054 | .040 | .028 | .268 | .129 | .422 | .051 | .045 | .072 | .002 | .012 | ||
| 2018 | 17,471 | 2.19 | .438 | .388 | .048 | .053 | .045 | .028 | .276 | .126 | .413 | .056 | .045 | .069 | .003 | .012 | ||
| 2019 | 17,073 | 2.24 | .444 | .382 | .048 | .052 | .045 | .028 | .279 | .134 | .404 | .056 | .047 | .067 | .001 | .012 | ||
| 2020 | 11,788 | 2.30 | .456 | .361 | .049 | .055 | .049 | .029 | .289 | .132 | .383 | .060 | .048 | .071 | .002 | .015 | ||
| 2021 | 16,652 | 2.24 | .452 | .370 | .043 | .053 | .053 | .028 | .278 | .139 | .391 | .064 | .042 | .069 | .003 | .013 | ||
| 2022 | 16,916 | 2.22 | .449 | .369 | .047 | .052 | .057 | .025 | .275 | .135 | .391 | .069 | .045 | .069 | .003 | .013 | ||
| 2023 | 16,932 | 2.21 | .446 | .370 | .043 | .056 | .057 | .029 | .271 | .142 | .390 | .070 | .043 | .072 | .002 | .011 | ||