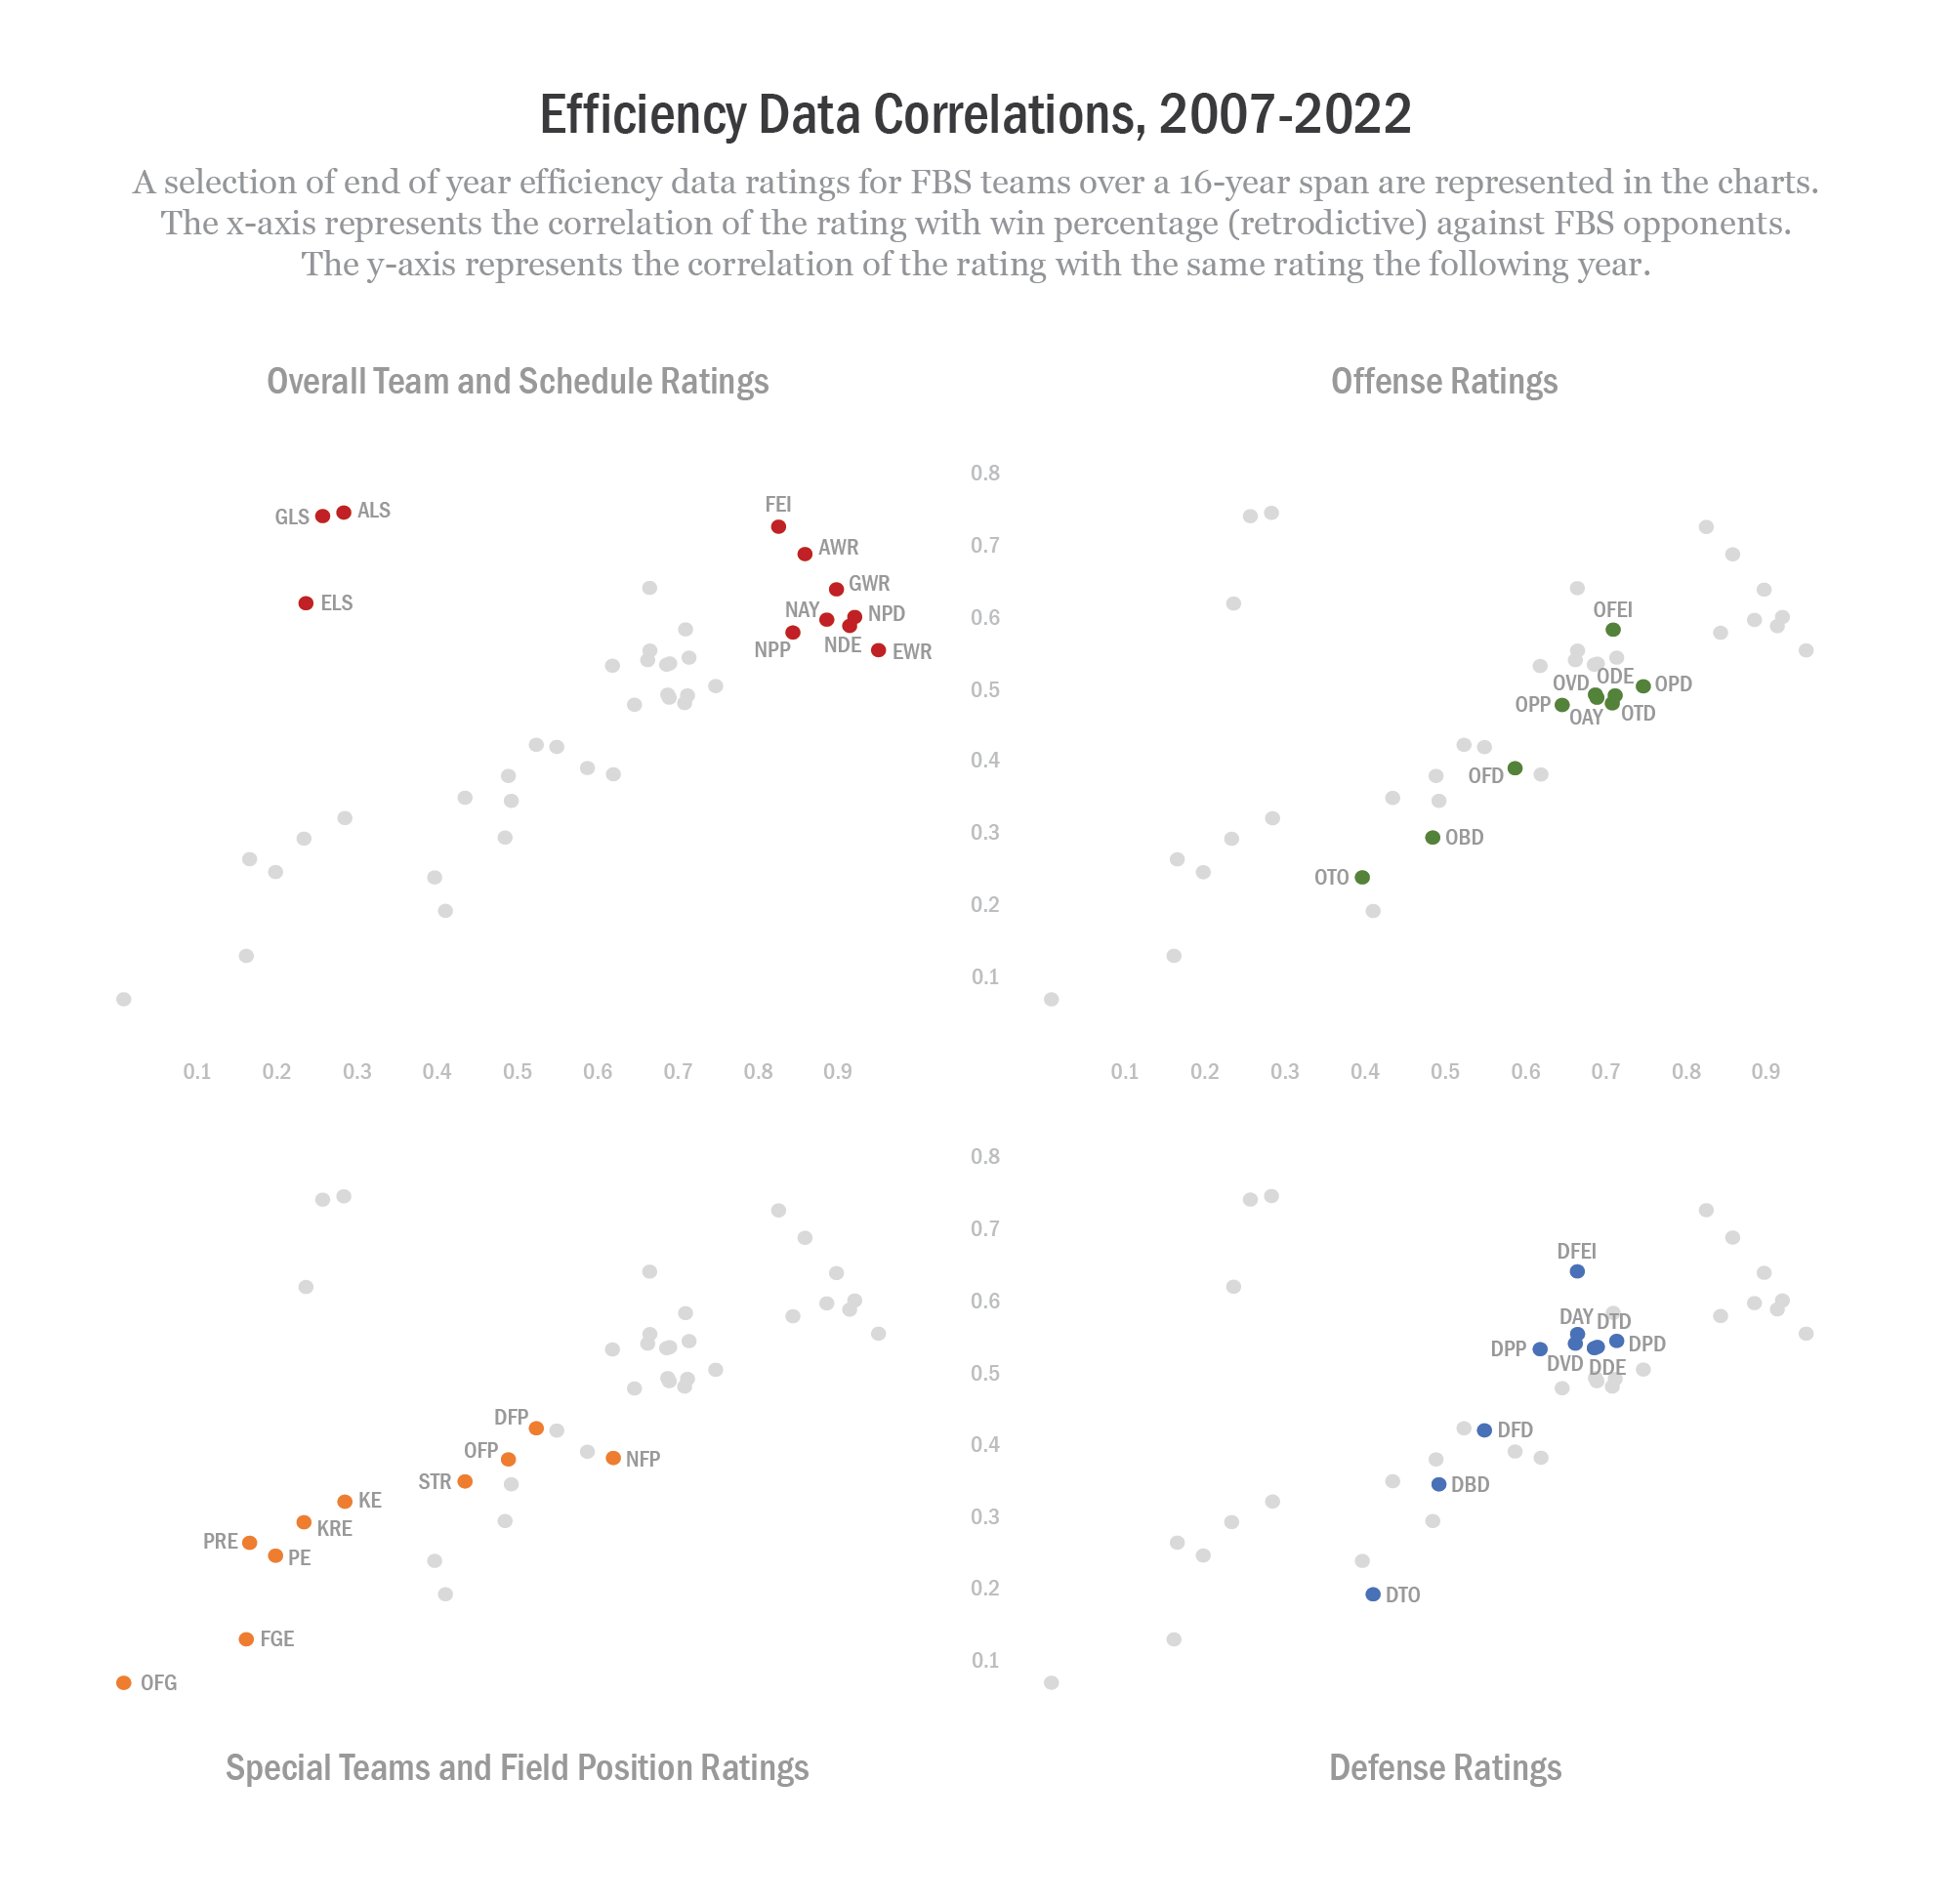
Overall Team and Schedule Ratings
|
|
Retrodictive
|
|
Next Season
|
| Rating |
Definition |
|
W% |
CW |
CM |
|
W% |
CW |
CM |
CR |
| FEI |
Opponent adjusted possession efficiency |
|
.792 |
.826 |
.607 |
|
.674 |
.469 |
.339 |
.725 |
| NDE |
Net drive efficiency |
|
.770 |
.915 |
.523 |
|
.648 |
.475 |
.289 |
.587 |
| NPD |
Net points per drive |
|
.768 |
.921 |
.537 |
|
.652 |
.482 |
.288 |
.600 |
| NAY |
Net available yards percentage |
|
.755 |
.886 |
.506 |
|
.647 |
.473 |
.285 |
.596 |
| NPP |
Net yards per play |
|
.742 |
.844 |
.480 |
|
.643 |
.460 |
.271 |
.578 |
| EWR |
Elite win rating |
|
.805 |
.951 |
.464 |
|
.642 |
.457 |
.272 |
.554 |
| GWR |
Good win rating |
|
.819 |
.898 |
.484 |
|
.652 |
.453 |
.312 |
.638 |
| AWR |
Average win rating |
|
.821 |
.859 |
.496 |
|
.658 |
.441 |
.331 |
.687 |
| ELS |
Strength of schedule (elite team perspective) |
|
.589 |
.236 |
.207 |
|
.579 |
.177 |
.208 |
.619 |
| GLS |
Strength of schedule (good team perspective) |
|
.602 |
.257 |
.263 |
|
.588 |
.200 |
.261 |
.740 |
| ALS |
Strength of schedule (average team perspective) |
|
.627 |
.283 |
.275 |
|
.596 |
.207 |
.264 |
.745 |
| |
| |
Offense Ratings
|
|
Retrodictive
|
|
Next Season
|
| Rating |
Definition |
|
W% |
CW |
CM |
|
W% |
CW |
CM |
CR |
| OFEI |
Opponent adjusted offensive drive efficiency |
|
.722 |
.710 |
.433 |
|
.632 |
.378 |
.257 |
.583 |
| ODE |
Offensive drive efficiency |
|
.705 |
.712 |
.395 |
|
.618 |
.348 |
.209 |
.491 |
| OPD |
Offensive points per drive |
|
.715 |
.747 |
.413 |
|
.628 |
.370 |
.220 |
.504 |
| OAY |
Offensive available yards percentage |
|
.692 |
.689 |
.387 |
|
.614 |
.339 |
.191 |
.488 |
| OPP |
Offensive yards per play |
|
.680 |
.646 |
.367 |
|
.612 |
.330 |
.163 |
.478 |
| OTD |
Offensive touchdown rate |
|
.702 |
.708 |
.389 |
|
.618 |
.351 |
.215 |
.480 |
| OVD |
Offensive value drive rate |
|
.696 |
.687 |
.381 |
|
.622 |
.337 |
.190 |
.492 |
| OFD |
Offensive first down rate |
|
.659 |
.587 |
.333 |
|
.597 |
.287 |
.131 |
.390 |
| OBD |
Offensive busted drive rate |
|
.629 |
.484 |
.263 |
|
.581 |
.263 |
.106 |
.293 |
| OTO |
Offensive turnover rate |
|
.615 |
.396 |
.187 |
|
.555 |
.137 |
.062 |
.238 |
| OLD |
Offensive points per drive (long field position) |
|
.644 |
.514 |
.268 |
|
.591 |
.260 |
.155 |
.309 |
| OMD |
Offensive points per drive (medium field position) |
|
.688 |
.664 |
.366 |
|
.609 |
.321 |
.199 |
.443 |
| OSD |
Offensive points per drive (short field position) |
|
.644 |
.517 |
.265 |
|
.586 |
.242 |
.143 |
.214 |
| O20 |
Offensive available yards percentage (to opp 20) |
|
.685 |
.674 |
.382 |
|
.610 |
.331 |
.183 |
.471 |
| O40 |
Offensive available yards percentage (to opp 40) |
|
.673 |
.640 |
.362 |
|
.604 |
.319 |
.168 |
.428 |
| O60 |
Offensive available yards percentage (to own 40) |
|
.649 |
.556 |
.309 |
|
.596 |
.282 |
.135 |
.342 |
| O4+ |
Offensive drives of at least 4 yards per play |
|
.677 |
.644 |
.363 |
|
.610 |
.330 |
.180 |
.451 |
| O7+ |
Offensive drives of at least 7 yards per play |
|
.679 |
.625 |
.343 |
|
.609 |
.304 |
.183 |
.455 |
| O10+ |
Offensive drives of at least 10 yards per play |
|
.661 |
.571 |
.312 |
|
.597 |
.283 |
.178 |
.408 |
| |
| |
Defense Ratings
|
|
Retrodictive
|
|
Next Season
|
| Rating |
Definition |
|
W% |
CW |
CM |
|
W% |
CW |
CM |
CR |
| DFEI |
Opponent adjusted defensive drive efficiency |
|
.715 |
.665 |
.434 |
|
.632 |
.393 |
.276 |
.640 |
| DDE |
Defensive drive efficiency |
|
.700 |
.686 |
.401 |
|
.615 |
.379 |
.238 |
.534 |
| DPD |
Defensive points per drive |
|
.706 |
.714 |
.420 |
|
.619 |
.396 |
.183 |
.544 |
| DAY |
Defensive available yards percentage |
|
.691 |
.665 |
.385 |
|
.615 |
.386 |
.132 |
.553 |
| DPP |
Defensive yards per play |
|
.679 |
.618 |
.356 |
|
.606 |
.361 |
.089 |
.532 |
| DTD |
Defensive touchdown rate |
|
.703 |
.690 |
.408 |
|
.614 |
.378 |
.190 |
.535 |
| DVD |
Defensive value drive rate |
|
.690 |
.662 |
.392 |
|
.610 |
.380 |
.172 |
.540 |
| DFD |
Defensive first down rate |
|
.649 |
.549 |
.315 |
|
.592 |
.321 |
.034 |
.419 |
| DBD |
Defensive busted drive rate |
|
.637 |
.492 |
.256 |
|
.593 |
.265 |
.161 |
.344 |
| DTO |
Defensive turnover rate |
|
.616 |
.410 |
.191 |
|
.558 |
.209 |
.111 |
.192 |
| DLD |
Defensive points per drive (long field position) |
|
.628 |
.454 |
.240 |
|
.571 |
.248 |
.130 |
.258 |
| DMD |
Defensive points per drive (medium field position) |
|
.685 |
.636 |
.361 |
|
.607 |
.363 |
.175 |
.472 |
| DSD |
Defensive points per drive (short field position |
|
.618 |
.433 |
.227 |
|
.565 |
.243 |
.084 |
.221 |
| D20 |
Defensive available yards percentage (to own 20) |
|
.683 |
.645 |
.368 |
|
.614 |
.380 |
.109 |
.536 |
| D40 |
Defensive available yards percentage (to own 40) |
|
.672 |
.610 |
.343 |
|
.611 |
.360 |
.082 |
.497 |
| D60 |
Defensive available yards percentage (to opp 40) |
|
.651 |
.534 |
.292 |
|
.596 |
.310 |
.049 |
.406 |
| D4+ |
Defensive drives of at least 4 yards per play |
|
.670 |
.606 |
.349 |
|
.602 |
.357 |
.112 |
.489 |
| D7+ |
Defensive drives of at least 7 yards per play |
|
.673 |
.600 |
.344 |
|
.604 |
.348 |
.165 |
.502 |
| D10+ |
Defensive drives of at least 10 yards per play |
|
.644 |
.537 |
.313 |
|
.591 |
.309 |
.157 |
.442 |
| |
| |
Special Teams and Field Position Ratings
|
|
Retrodictive
|
|
Next Season
|
| Rating |
Definition |
|
W% |
CW |
CM |
|
W% |
CW |
CM |
CR |
| STR |
Special teams rating |
|
.611 |
.434 |
.216 |
|
.579 |
.255 |
.151 |
.349 |
| KRE |
Kickoff return efficiency |
|
.569 |
.233 |
.130 |
|
.544 |
.168 |
.058 |
.292 |
| KE |
Kickoff efficiency |
|
.582 |
.284 |
.174 |
|
.560 |
.140 |
.136 |
.320 |
| PRE |
Punt return efficiency |
|
.545 |
.165 |
.094 |
|
.531 |
.139 |
.070 |
.263 |
| PE |
Punt efficiency |
|
.557 |
.198 |
.097 |
|
.540 |
.075 |
.060 |
.245 |
| FGE |
Field goal efficiency |
|
.540 |
.161 |
.079 |
|
.532 |
.057 |
.060 |
.129 |
| OFG |
Opponent field goal efficiency |
|
.502 |
.008 |
.016 |
|
.498 |
.064 |
.005 |
.069 |
| OFP |
Offensive starting field position |
|
.635 |
.488 |
.254 |
|
.588 |
.292 |
.053 |
.379 |
| DFP |
Defensive starting field position |
|
.648 |
.523 |
.292 |
|
.592 |
.251 |
.074 |
.422 |
| NFP |
Net starting field position |
|
.659 |
.619 |
.313 |
|
.600 |
.331 |
.195 |
.381 |